
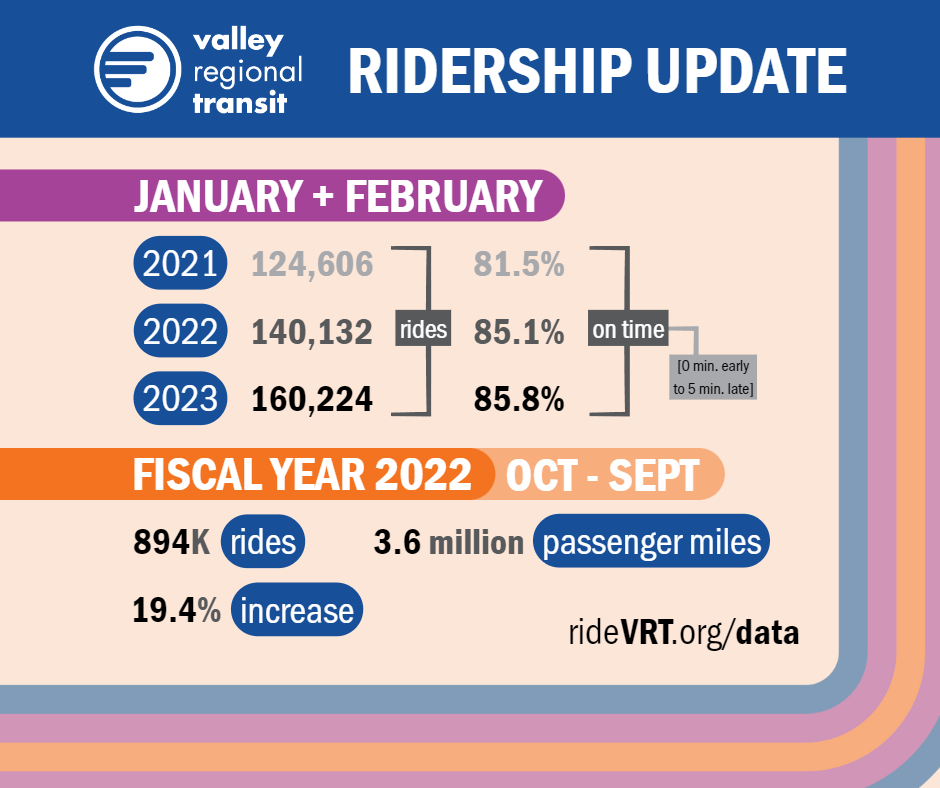
 VRT bus rides continue to rise! This month, we’re taking a look at ridership from Fiscal Year 2022 (which ran from October 2021 to September 2022), and comparing ridership from January and February this year to 2022 and 2021.
January + February
| Year | Rides | On time (0 min. early to 5 min. late) |
| 2021 | 124,606 | 81.5% |
| 2022 | 140,132 | 85.1% |
| 2023 | 160,224 | 85.8% |
FISCAL YEAR 2022 (OCTOBER ’22 – SEPTEMBER ’22)
- 893,935 rides (13.2% increase over Fiscal Year 2021)
- 1,357,971 revenue miles
- 78,764 revenue hours
- 3,625,232 passenger miles travels
- 84.56% average on-time performance
Check out the data